Bitcoin ETF outflows, geopolitical turmoil, and higher interest rates are putting downside pressure on BTC price.
The price of Bitcoin
BTC
$62,922 has corrected 13.65% almost a month after setting a new record high of around $73,800. As of April 17, BTC/USD is trading for as low as $$62,622, while its month-to-date low is around $62,160.
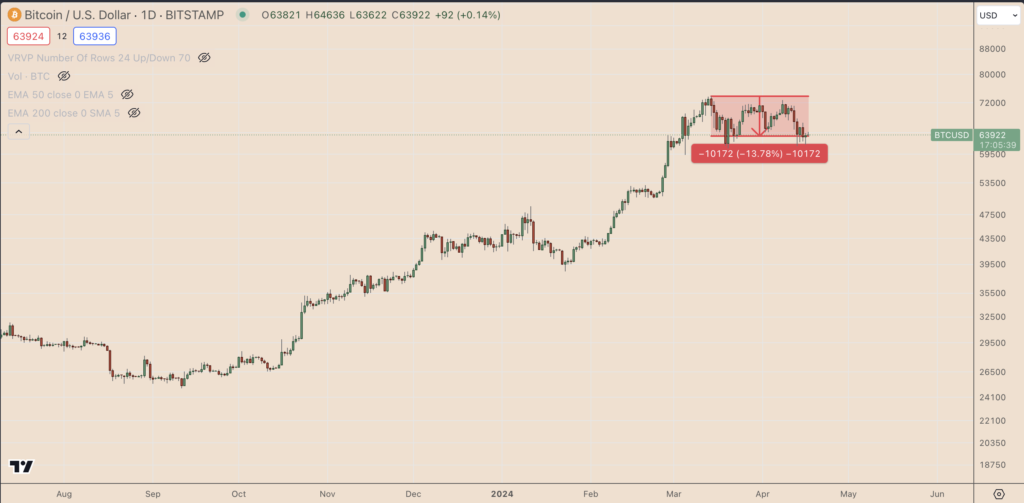
Bitcoin’s price correction has accelerated recently due to an escalating geopolitical conflict in the Middle East. Meanwhile, a resilient U.S. economy has increased bets on higher-for-longer interest rates in the U.S., which has dampened the market’s risk appetite, hurting Bitcoin further.
With the Bitcoin Halving 2024 just two days away, will the BTC price crash again or undergo a sharp rebound?
Bitcoin triple-top theory predicts 14% price decline
Bitcoin has failed to jump above its record high thrice in the past 30 days, reflecting traders’ uncertainty near record levels, where profit-taking or increased selling pressure prevents further upside.
This price behavior has led to the formation of what appears to be a triple-top technical pattern, characterized by three consecutive peaks at around the same price level, with two minor pullbacks in between.
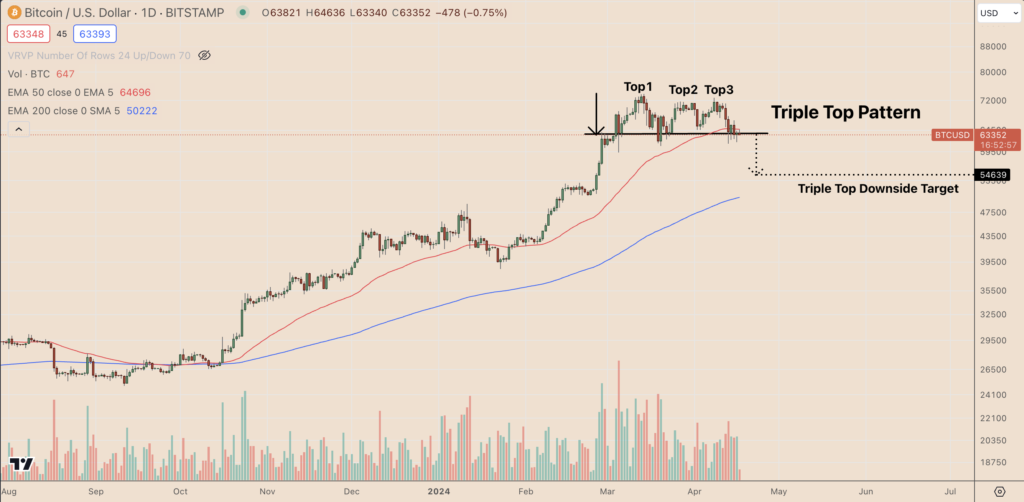
As a rule of technical analysis, a triple-top pattern typically concludes when the price breaks below its support line and descends by an amount equal to the peak height above that support line. As of April 17, Bitcoin is attempting to close below its triple-top support level near $63,500.
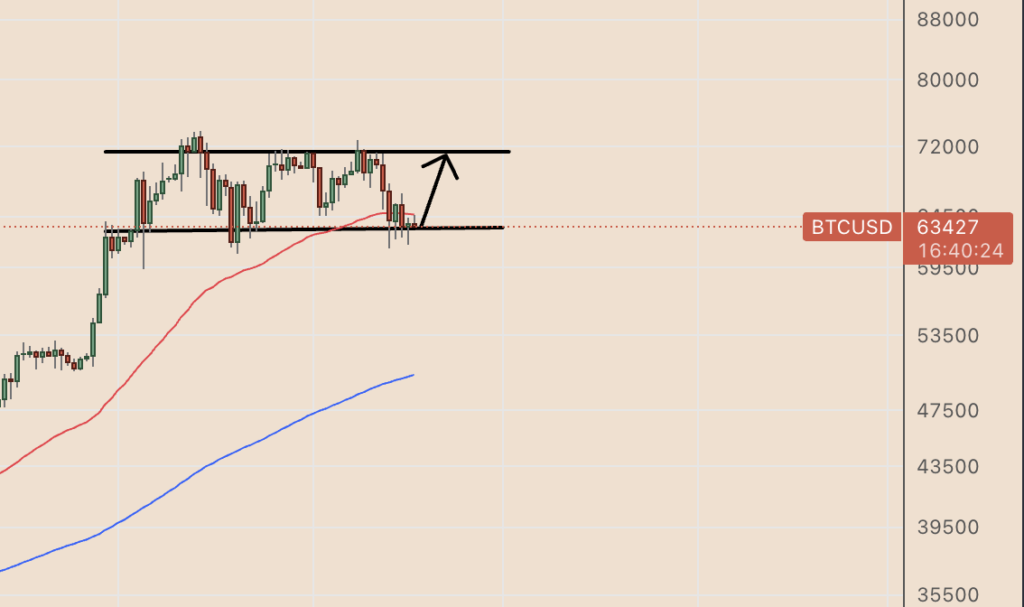
If this occurs, its downside target for April or May comes to around $54,650, down about 14.25% from the current price levels. If not, BTC price will likely rebound toward the upper trendline of its prevailing trading range at around $70,000.
Big institutions aren’t buying Bitcoin anymore?
More downside cues for Bitcoin come from the popular Wyckoff method, as analysts at Stockmoney Lizards in their recent X post.
Notably, Bitcoin’s recent price rallies and retreats resemble the trends typically witnessed during the formation of a Wyckoff Distribution Model, as shown below. As of April 17, the cryptocurrency had entered the pattern’s so-called “sign of weakness” stage.
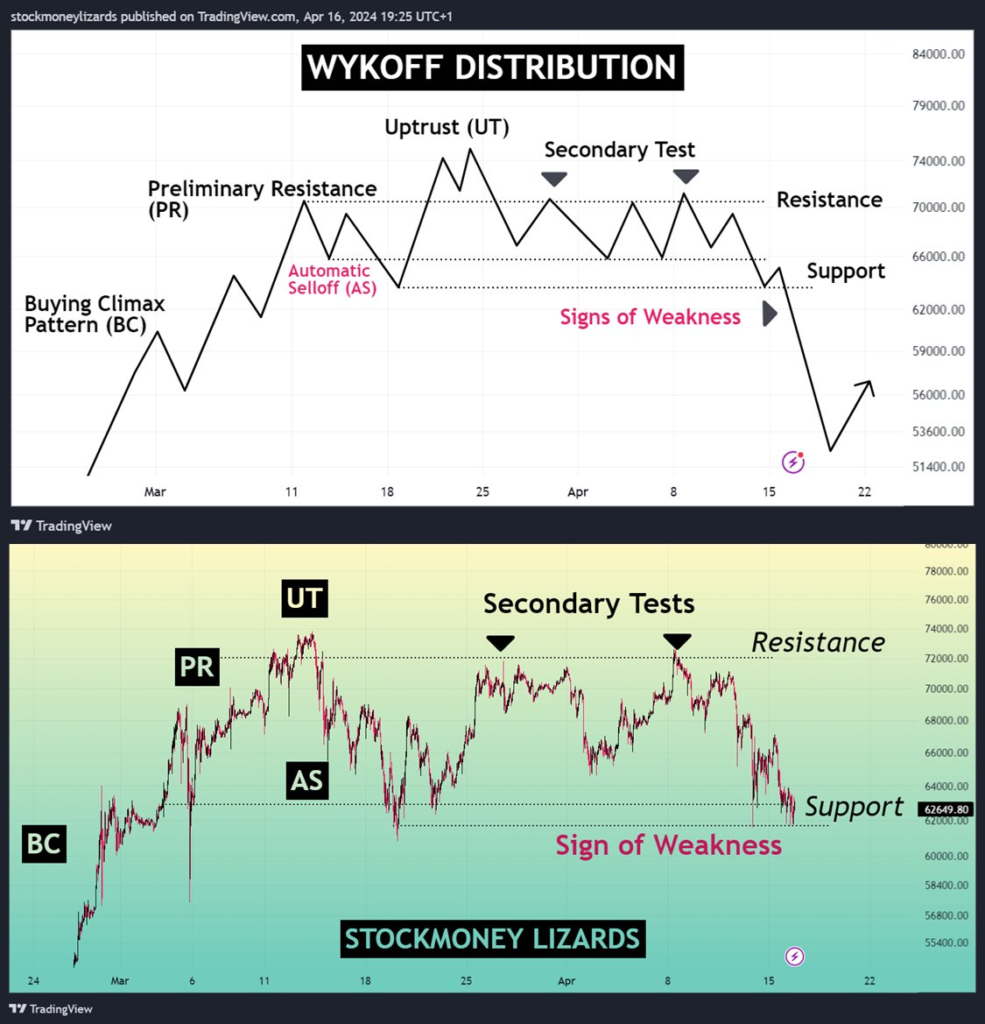
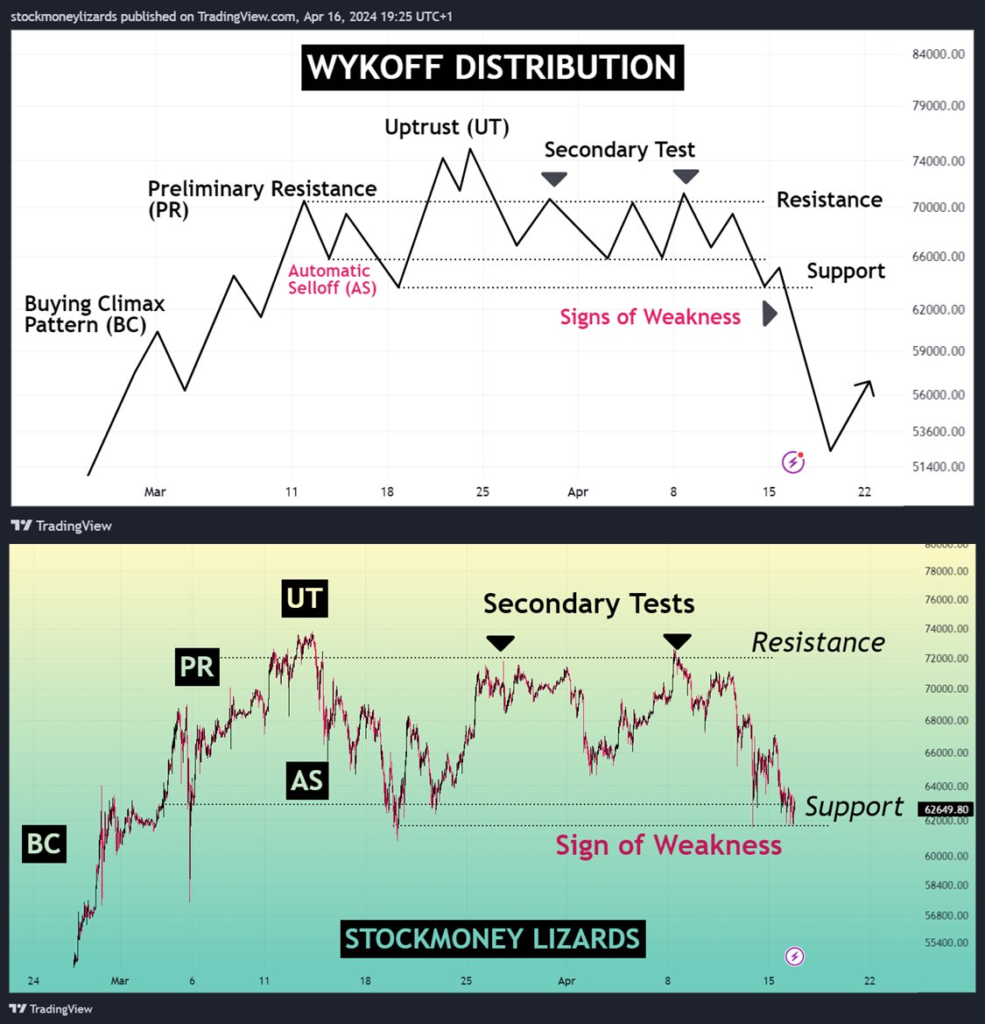
This stage suggests that demand is waning, which, in turn, sets up the asset for a downward move. In Bitcoin’s case, a lack of demand is due to a growing risk aversion mood caused by the Federal Reserve’s higher-for-longer interest rate policy and the escalating Iran-Israel conflict, opines StockMoney Lizards.
“Big institutions have paused their buying for now,” the analysts argued, adding:
“The inflow of the ETFs is as low as never before. Our guess: They sense that difficult times in the market might come.”
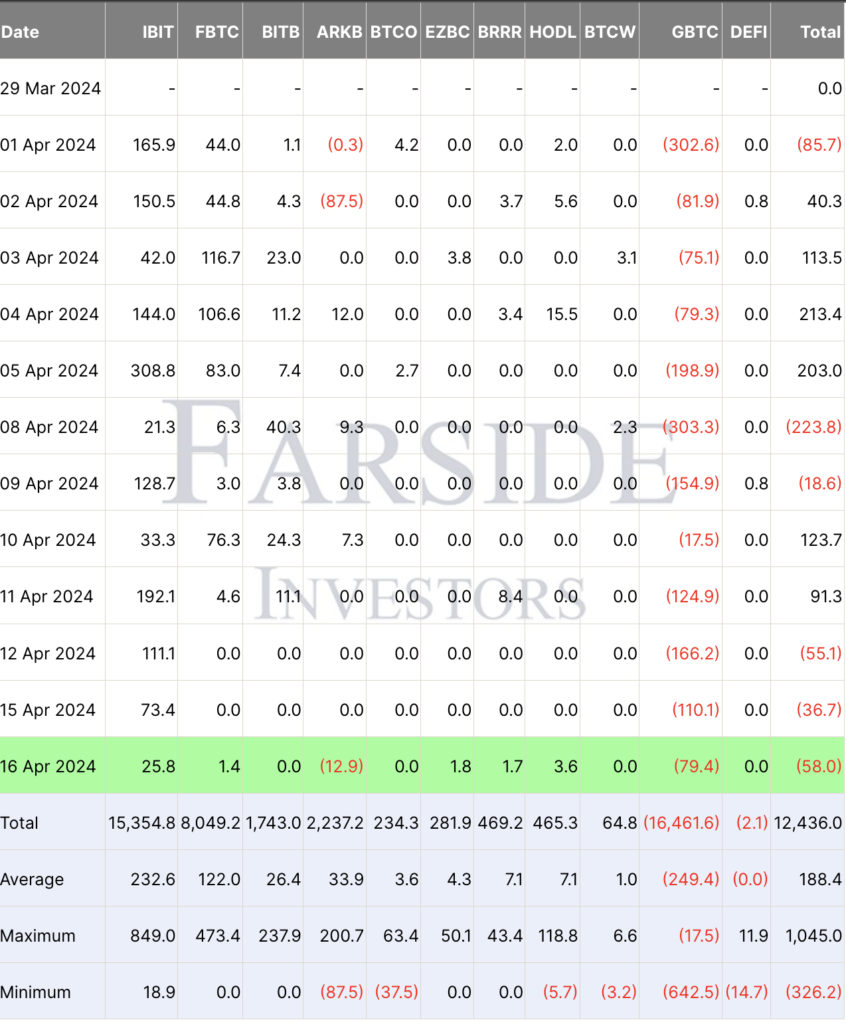
Bitcoin ETFs have witnessed nearly $150 million in outflows since the beginning of the Iran-Israel conflict on April 12, according to data by Farside Investors.
BTC will hit $75,000, predicts another analyst
A segment of the Bitcoin market remains optimistic about the possibility of a prolonged BTC bull run in the coming months.
For instance, analyst Christopher Inks cites an in-development Adam and Eve pattern for his bullish reversal call. This pattern is characterized by a sharp, V-shaped bottom followed by a more rounded, U-shaped bottom, as shown below.
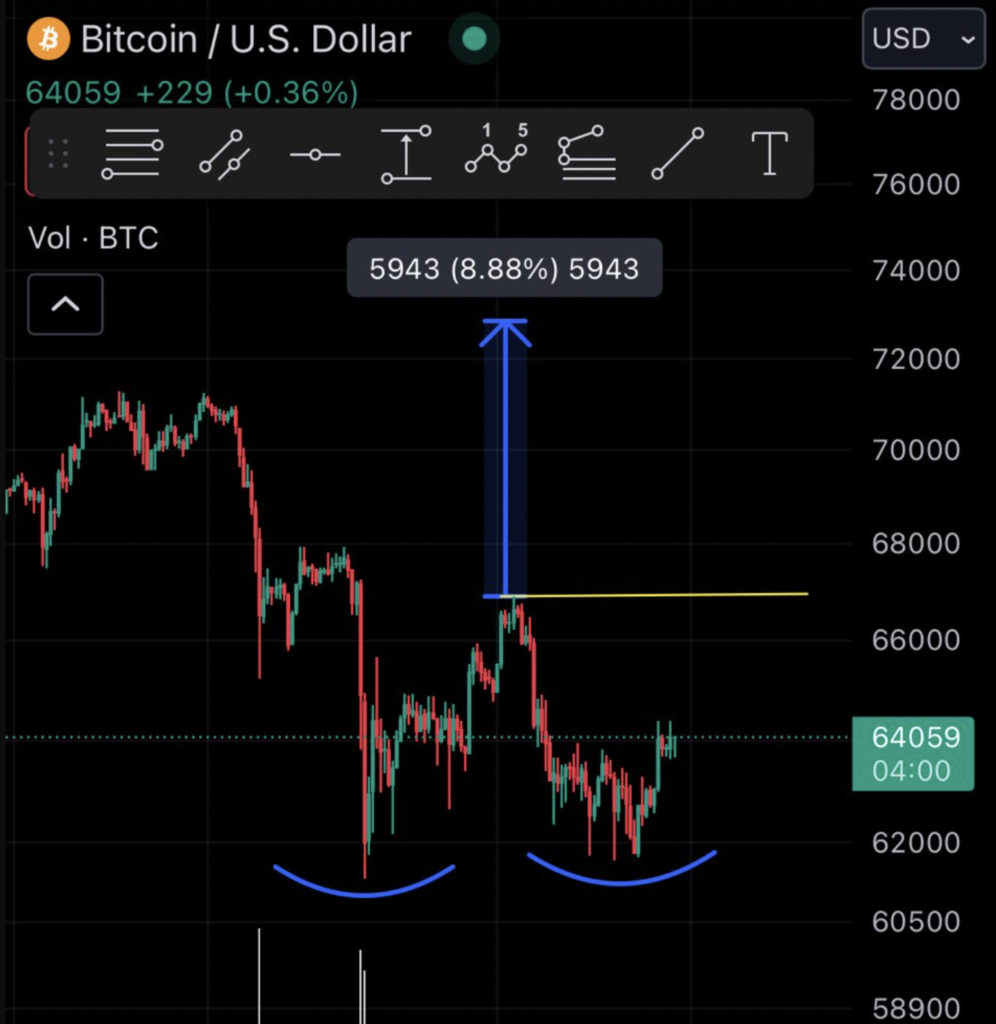
Inks notes that the BTC price could rally toward $75,000 — a new record high — if Adam and Eve play out as intended in the coming days. According to technical analysis principles, Adam and Eve patterns typically conclude when the price surpasses their resistance level and climbs an amount equivalent to the pattern’s maximum height.
Similarly, data analytics platform CryptoQuant notes that Bitcoin’s withdrawals from exchanges have reached their highest level since January 2023, indicating strong accumulation during the ongoing price dips.
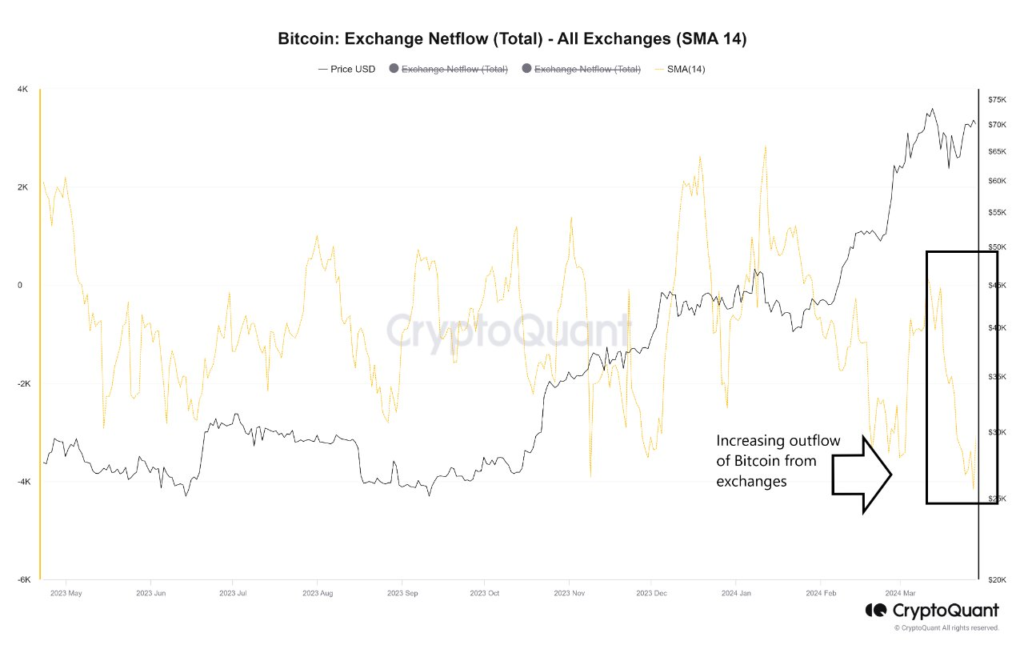
In other words, many traders anticipate Bitcoin can avoid a major price crash despite the weakening market sentiment in the past month.
Original source: https://cointelegraph.com/news/is-bitcoin-price-going-to-crash-again


